| Home » Categories » Multiple Categories |
Data Visualisations |
|
Article Number: 2234 | Rating: Unrated | Last Updated: Mon, Jun 19, 2023 at 7:31 PM
|
|
This new application builds on the Landing Pages facilities to allow a tabbed view of the application data with different filter criteria, and allows various charting and analysis views against each ‘record set’.
Multiple Record Sets
The existing Landing Page function allows for one ‘record set’ or view of the data. This new facility allows you to create multiple views of the data with different filters.
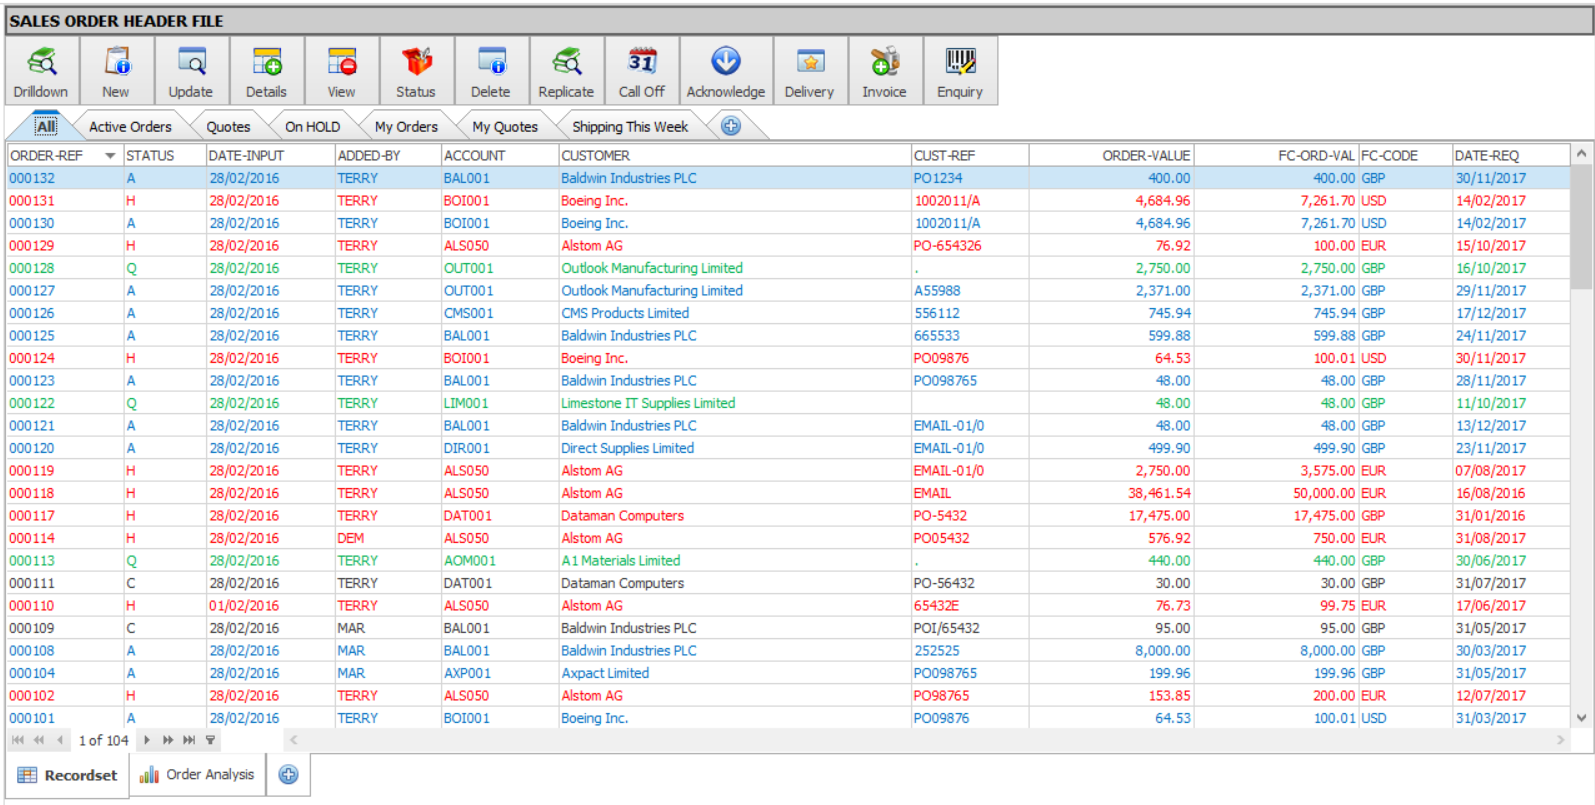
Here the Sales Order Processing application has been configured to display multiple record sets allowing users to swap between views and quickly access the required data.
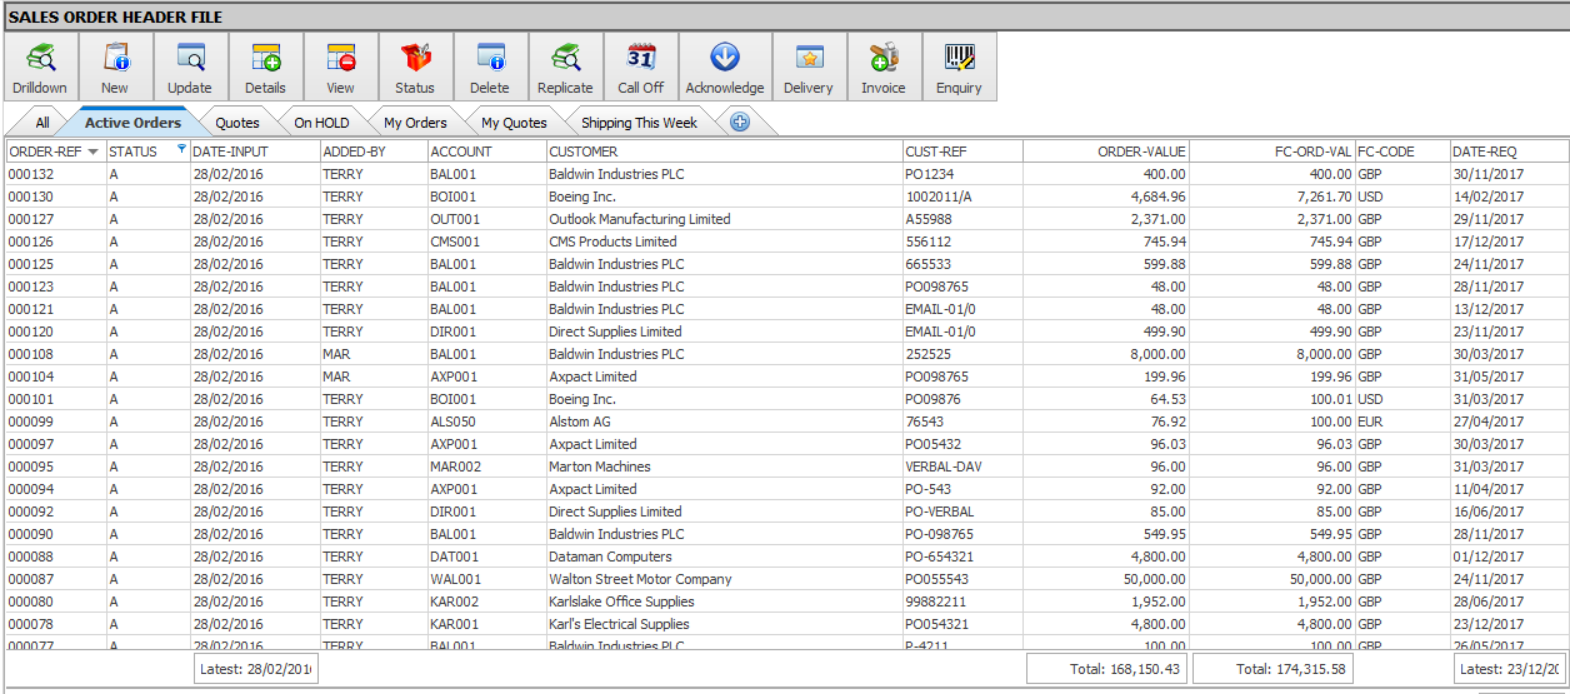
In addition to the ‘All’ tab, further tabs have been created to show just the active orders, just the quotes, just the orders on hold and so on. The record sets you create are up to you.
Each application has a main data ‘set’ – these are the records selected based on any selection criteria and record limits defined within the Landing Page setup. Each record set or tabbed view is based on this data with additional filters defined to restrict the records displayed to the key data required for that view.
To create a new record set you can select the ‘+’ tab or select the ‘New Record Set’ option on the Landing Page ribbon. This will create a new ‘tab’ using the default data items / sort order defined within the Landing Page setup. You can rename the view by double-clicking the title or use the rename option on the ribbon.
Once the record set has been created the usual landing page functionality is available to apply filters, apply colour highlight rules, change the sort order or data items displayed.
Charts
Against each record set you can create ‘Chart’ views. Each Chart view allows for multiple levels of an on-screen drill down. The records analysed in each chart set is based on the filters for that record set.
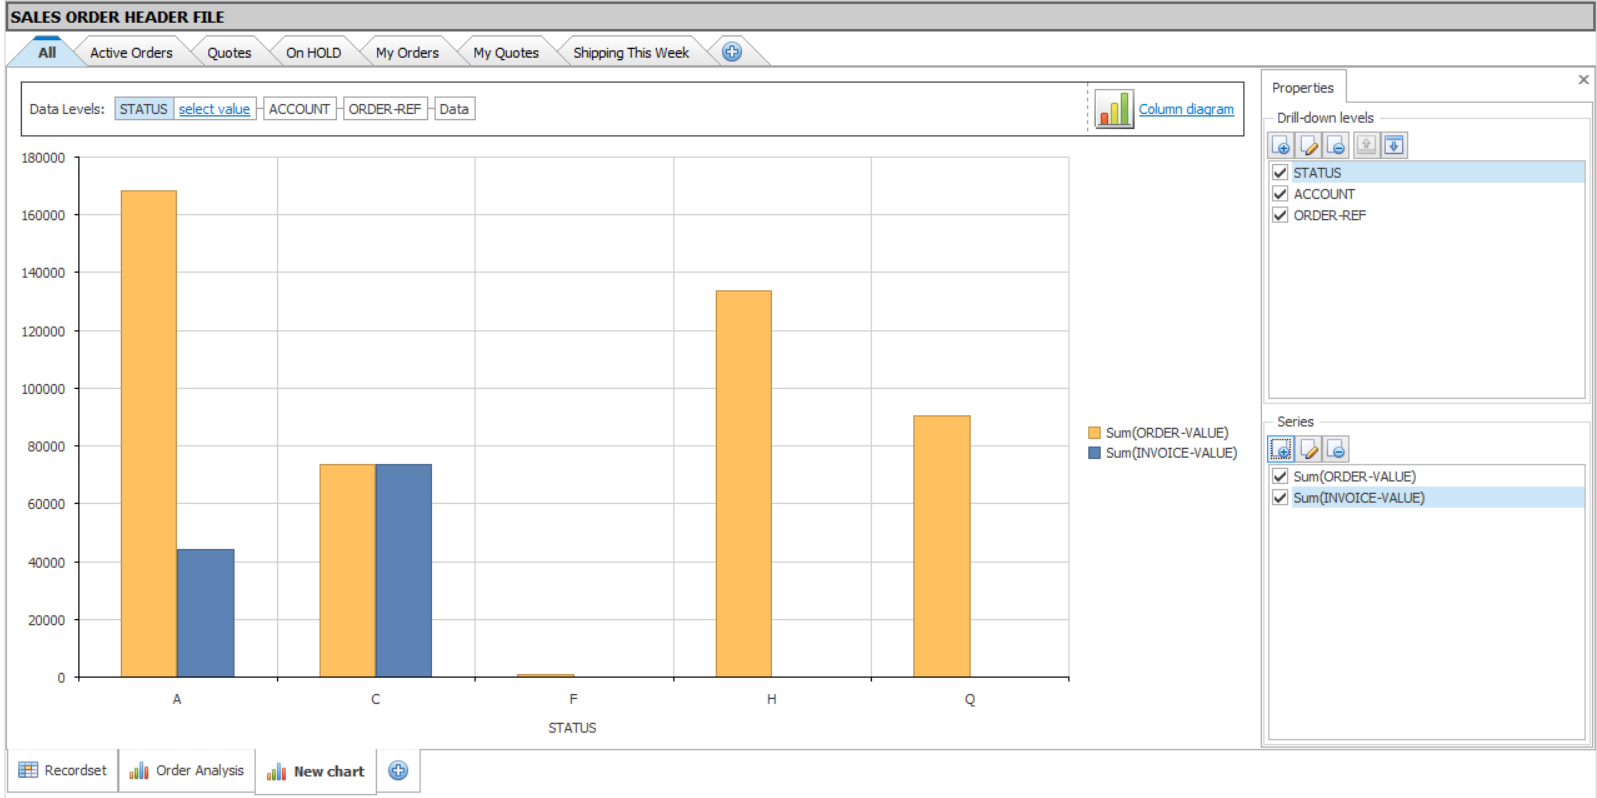
Here a chart view has been created for the Sales Orders – the initial view is based on the order status, from here you can click on a column in the bar chart and drill-down to see the breakdown by account and from there to the individual orders.
To create a new chart click the ‘+’ icon on the tabs at the bottom of the screen and select to create a new chart or click the ‘New Chart’ option on the Landing Page ribbon. A default chart is created for you using the key field (typically prime-index) and the first value item – click the ‘Show Properties’ option to amend the drill-down levels and the series values.
If you select a ‘date’ data item (E-type) you have additional options to control how the date is analysed – the full date, day of the week, week, month and so on.
You can edit a level by highlight and clicking the edit (second) icon, you can remove a level by highlighting and clicking the delete (third) icon. You can also change the order of the drill-down levels by highlighting the entry and using the up/down icons.
You can also create a series analysis of the selected value data item based on a date item – displaying the values by day, week, month etc.
Calendar
Against each record set you can create a calendar view. This can be viewed as an Agenda, Weekly, Monthly, Half Year or Full Year format. You can optionally drag/drop the events and edit the underlying data.
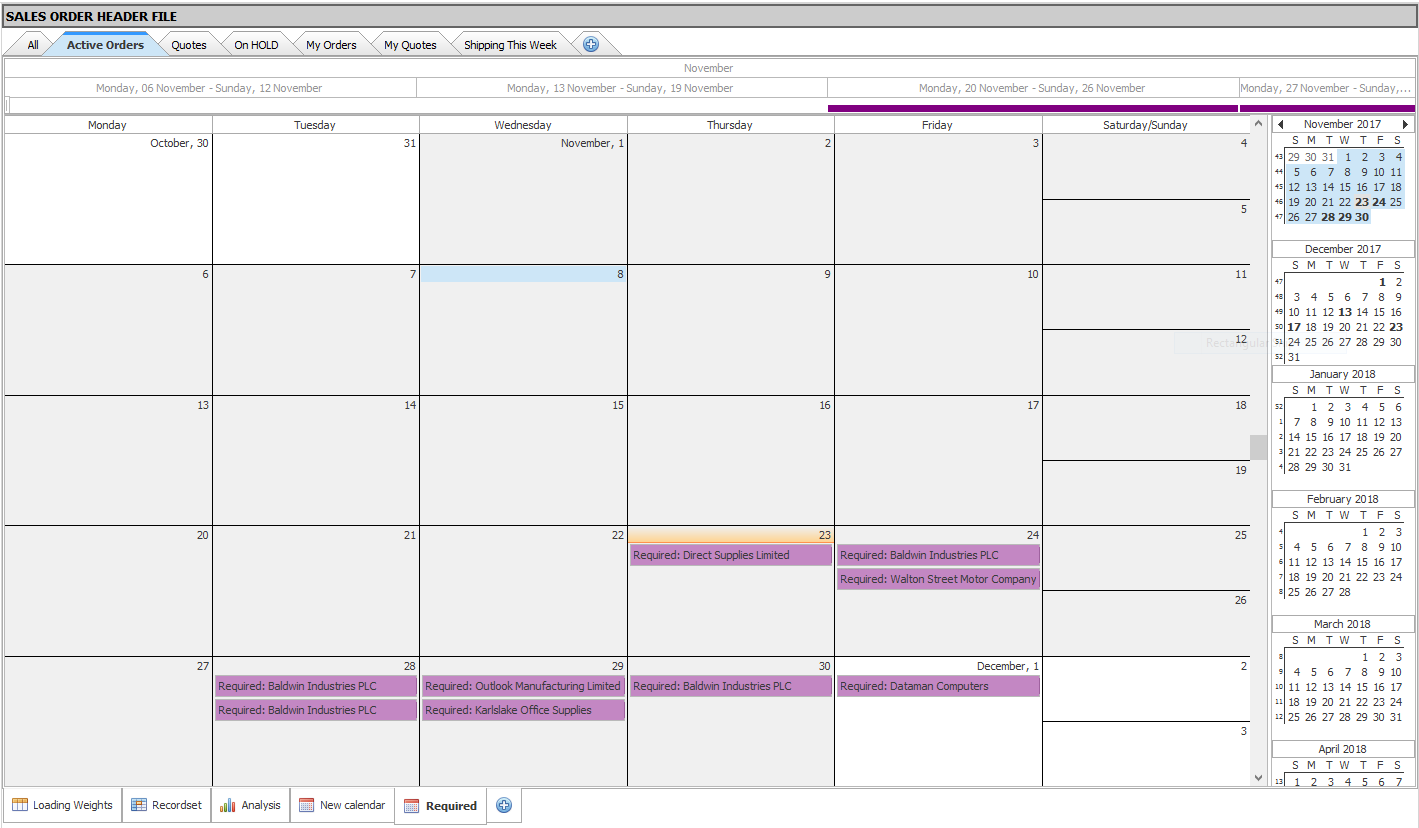
Here a calendar view has been created on a record set for ‘Active Orders’ in Sales Order Processing showing the ‘Date Required’ for the orders.
To create a new calendar click the ‘+’ icon on the tabs at the bottom of the screen and select to create a new calendar or click the ‘New Calendar’ option on the Landing Page ribbon. The default view is Monthly – click the ‘Show Properties’ option to select the date items to display.
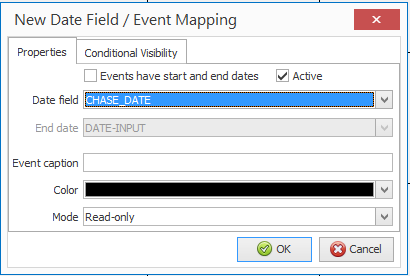
Active – set to show this item within the calendar view.
Date Field – select the date data item to view (only E-type dates are allowed for selection)
End Date – select the date as appropriate.
Event Caption – set the label to display on the calendar (i.e. ‘Required’ or ‘Chase’ etc.)
Colour – set the colour the event is to display in.
Mode – set whether the calendar event is to be read-only (cannot drag within the calendar), confirm edits (a pop-up form is displayed to OK if drag/drop event, or editable (allows move of the event).
Conditional Visibility – this tab allows you to omit display of an event subject to criteria. The criteria are formula based so only numeric / Boolean items can be tested.
Timeline
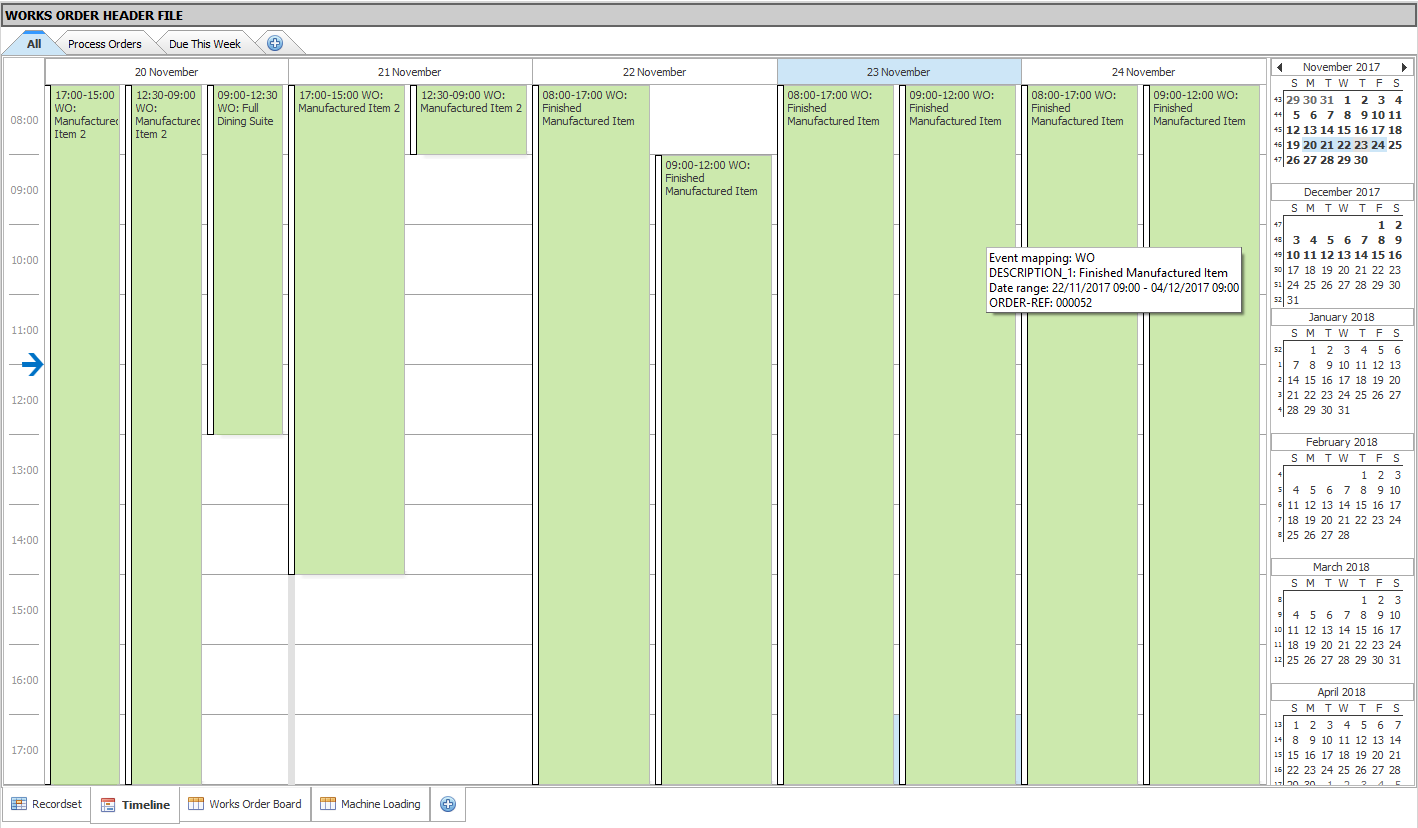
Against each record set you can create a Timeline view. The Timeline view is like the Calendar except that it requires start dates and end dates and has an optional time entry parameter.
Here a timeline view has been created on a record set for Works Order Processing
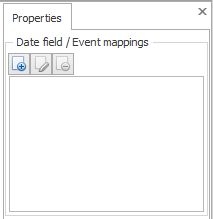
To create a new timeline click the ‘+’ icon on the tabs at the bottom of the screen and select to create a new timeline or click the ‘New Timeline’ option on the Landing Page ribbon. The default view is the Days in the Week timeline – click the ‘Show Properties’ option to select the date items to display.
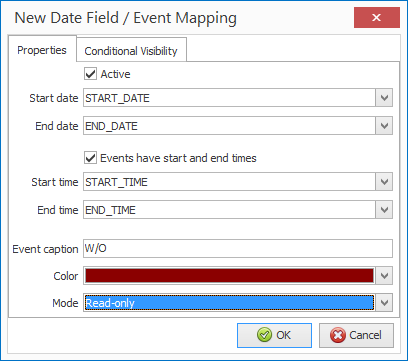
To choose a date for display select the new option (first icon) and a pop-up form will be displayed to allow configuration of the date settings.
Active – set to show this item within the view.
Start Date – select the date data item to view (only E-type dates are allowed for selection)
End Date – select the date as appropriate.
Events Have Start and End Times– set if recording event times.
Start time – select the time data item (N-type) for start time.
End Time – select the time data item for the end time.
Event Caption – set the label to display on the calendar (i.e. ‘W/O’ etc.)
Colour – set the colour the event is to display in.
Mode – set whether the calendar event is to be read-only (cannot drag within the calendar), confirm edits (a pop-up form is displayed to OK if drag/drop event, or editable (allows move of the event).
Conditional Visibility – this tab allows you to omit display of an event subject to criteria. The criteria are formula based so only numeric / Boolean items can be tested.
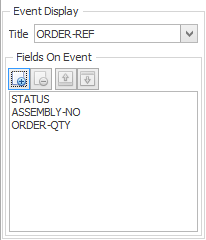
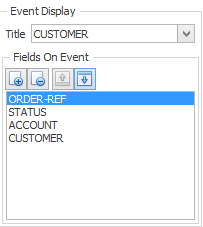
The Event Displayproperties allow you to select a data item for display on the calendar page (title) plus data items to view as a ‘highlight’ when mouse hovers over the event, and when drag/drop an event that is to be ‘confirmed’.
One of the functions for the timeline is to restrict the view to the working day. By default, this is Monday-to-Friday and 09:00-17:00. You can amend this by selecting the record set and choose the ‘Advanced Properties’ tab on the properties of the record set.
Kanban View
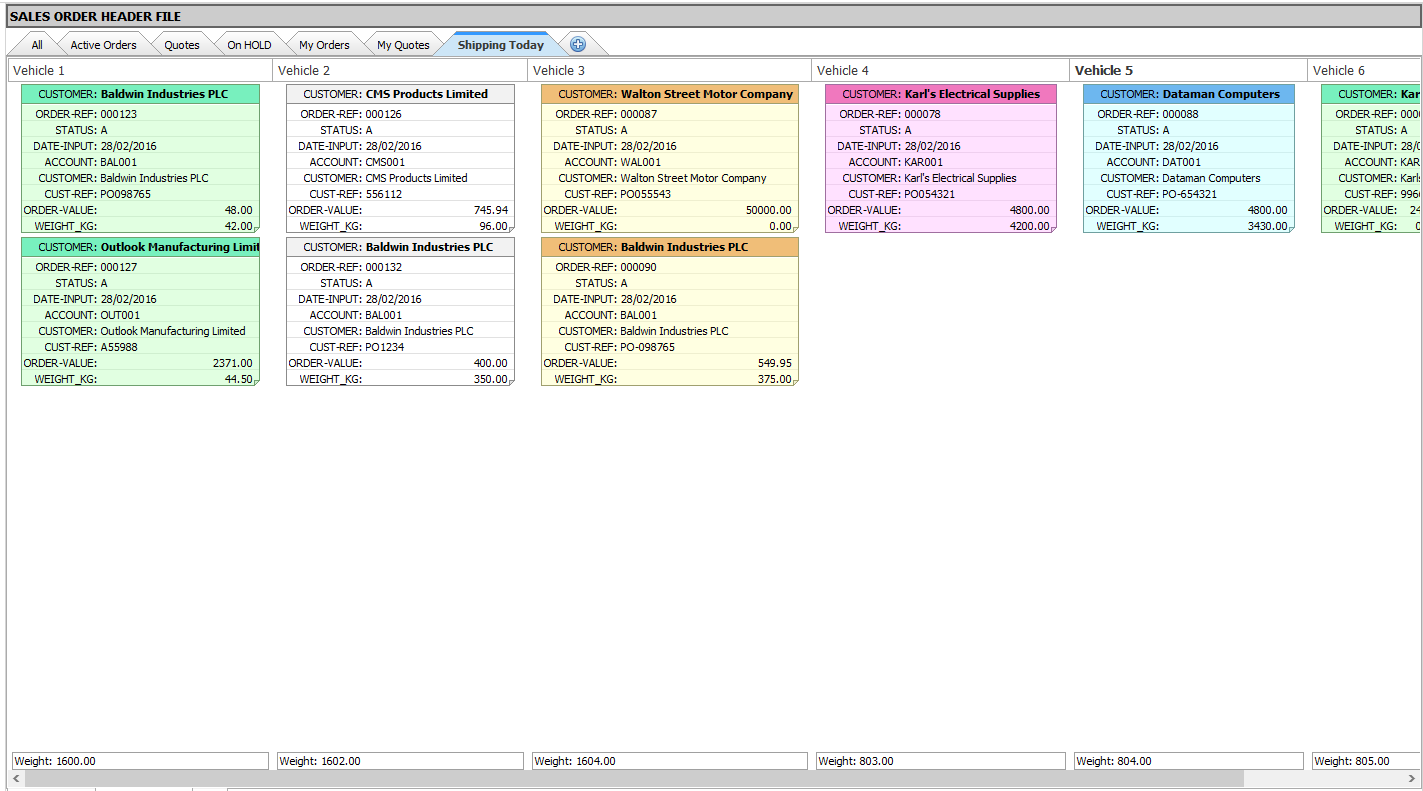
Against each record set you can create a Kanban view. This allows for the categorisation of records to be shown in a card view, totals can be displayed and drag/drop will recategorize and update the totals.
Here a Kanban view has been created on a record set for Works Order Processing
To create a new view click the ‘+’ icon on the tabs at the bottom of the screen and select to create a new Kanban or click the ‘New Kanban’ option on the Landing Page ribbon. Click the ‘Show Properties’ option to configure the display.
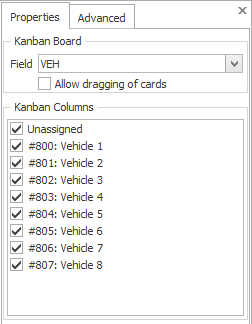
Properties
Field – select the table data item that is used for the category views.
Allow Dragging of Cards – set to allow the user to change the category (table analysis value) from the chart view.
Kanban Columns – this lists the table values defined for this item, tick the columns to be displayed.
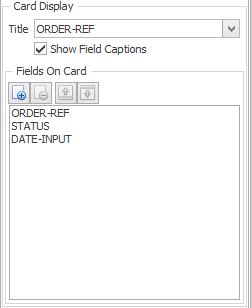
Title – select the data item to use as the title.
Show Field Captions – set to show field names as well as values, leave blank for just the values.
Fields On Card – select the data items to be displayed on the Kanban card.
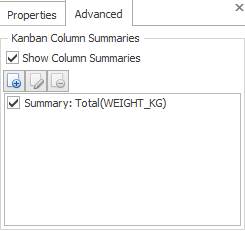
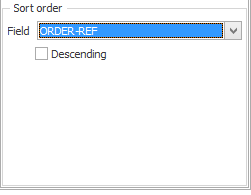
The Advanced Tab allows you to define the column totals and the sort order.
To add a summary item select the new total option (first icon) and set the Title, whether the item is active, the data item to total and the summary type (total, average, range).
Installation
The Data Visualisation tools are available immediately on installation of licence file that supports the application. Once installed the ‘Landing Page’ setup option contains additional items to control authority levels.
Landing Page Setup
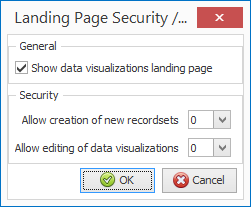
On the first page of the Landing Page setup parameters is the option button ‘Security / Configuration’, selecting this option shows pop-up form to set the authority levels.
Allow Creation of New Record Sets – set the authority level required for the user to be able to create a new record set.
Allow Editing of Data Visualisations – set the authority level required for the user to be able to create new charge views and edit existing view properties.
In addition, the data items available within the Define Extra Fields to Load property control the data items that are available for inclusion on the chart views.
|
Attachments

There are no attachments for this article.
|
Additional Display Options for Nominal / Cashbook Enquiry
Viewed 2984 times since Fri, Oct 26, 2012
Custom Page Sizes
Viewed 2703 times since Wed, Jun 13, 2012
Which Price Matrix Entries
Viewed 3060 times since Fri, May 20, 2016
Landing Pages - Additional Options
Viewed 1698 times since Wed, Jun 17, 2020
Emails in HTML Format (Outlook 2007)
Viewed 5303 times since Mon, Jun 11, 2012
4K Record Size Limit
Viewed 2775 times since Wed, Jun 13, 2012
Documents to Email - Merge PDF Attachments
Viewed 5900 times since Mon, Jun 11, 2012
Datafile Software - Menu Parameter Listing
Viewed 3659 times since Wed, Jun 13, 2012
Email Search Option
Viewed 2320 times since Mon, Jun 11, 2012
Job Costing Category Analysis
Viewed 4051 times since Tue, Jun 12, 2012
|
| Datafile Home | KB Home | Advanced Search |
|
 |
|
|
|
|
|
|
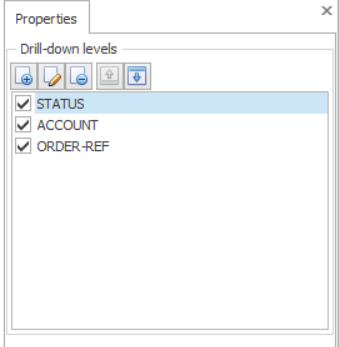 To create a new
drill-down level click the first icon – you will be prompted for the data
item. Select as required – the items
available are those defined within the ‘Define Extra Fields to Load’ options in
the Landing Page setup.
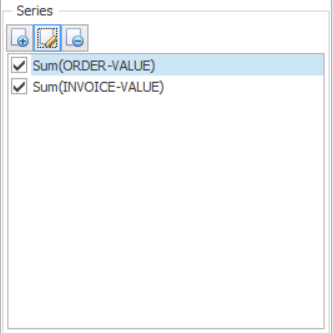 To create a value to
be analysed select the new (first) icon. Select the value data item and whether the value is to be a sum, count,
average or show the minimum or maximum value.
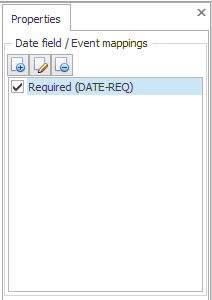 To choose a date for
display select the new option (first icon) and a pop-up form will be displayed
to allow configuration of the date settings.
 The
The 